
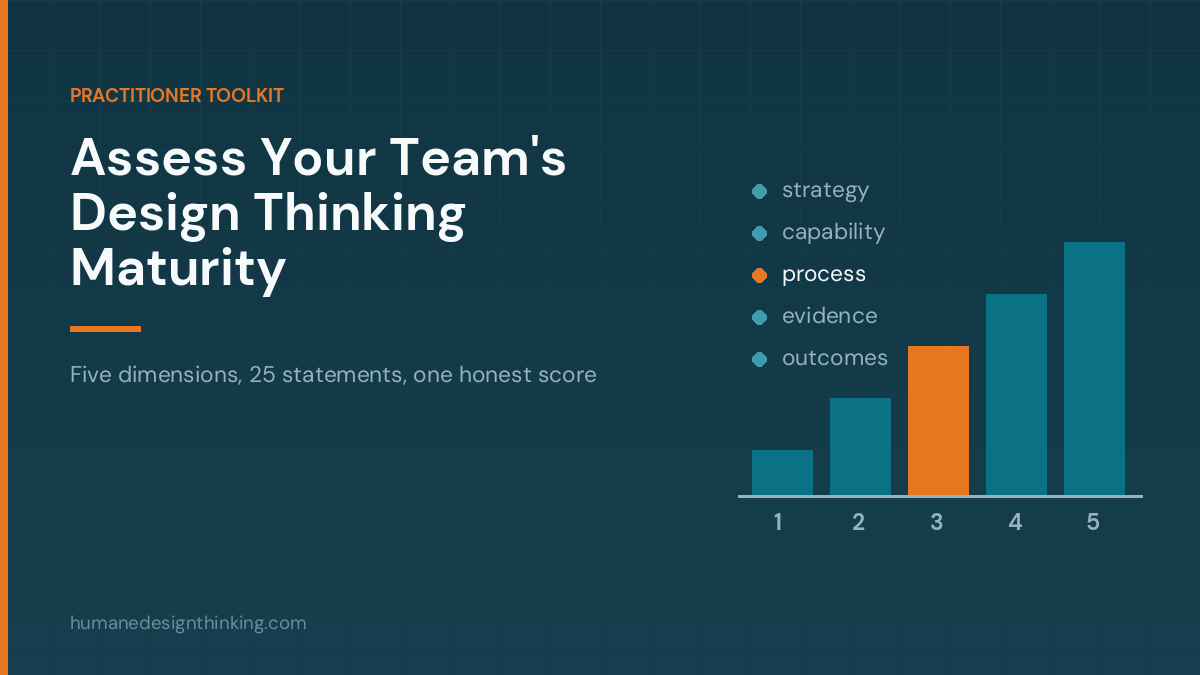
Most teams assess their design thinking capability by how the workshops feel. Energy in the room, sticky notes on the wall, a satisfied sponsor. None of these correlate with whether the practice is changing decisions. This guide gives practitioners a way to assess maturity that does: five dimensions, a 25-statement self-scoring instrument you can run in ninety minutes, a scoring band that maps to a realistic next move, and a diagnostic table that connects the symptoms you actually see to the dimension causing them.
The short answer: Assess design thinking maturity across five dimensions — strategy, capability, process, evidence and outcomes — rather than by counting workshops or trained people. Score each on a 1–5 scale using the 25-statement instrument below, then act on your lowest dimension, not your average. The established models are useful references: NN/g’s six-stage UX maturity model (absent, limited, emergent, structured, integrated, user-driven) and InVision’s five-level design maturity model are the two most widely used. The critical finding across both is that most organisations sit near the bottom — InVision found 41% of over 2,200 companies at Level 1, and NN/g’s self-assessment data placed half of 5,371 respondents at stage 3 of 6.
Why maturity assessment, and why it usually goes wrong
The purpose of a maturity assessment is not a score. It is a shared, specific diagnosis that a team and its sponsor can both act on. Assessments fail when they produce a number without a next move, or when the number becomes a performance target in itself.
Three ways they go wrong:
- Self-report inflation. Practitioners rate their own practice. Everyone scores themselves generously on the dimensions they own. Countermeasure: score against observable evidence, not intention — every statement in the instrument below is written so that it can be verified by pointing at an artefact.
- Averaging. A team scores 4 on capability and 1 on outcomes, reports 2.5, and treats itself as mid-maturity. It is not. It is a skilled team with no route from work to impact, which is a specific and fixable condition that the average conceals.
- Ladder thinking. Teams treat maturity as a one-way climb to a final stage. NN/g have been explicit that this is the wrong reading — their framing is that UX maturity is a living system rather than a ladder, needing ongoing care and capable of regressing when leadership, budget or key people change.
That last point matters more than it sounds. Maturity is not durable. A team can lose two stages in a quarter through a reorganisation, and a practice that is not actively maintained decays.
The established models, compared honestly
Before offering another instrument, it is worth being clear about what already exists and what each model is actually good for.
| Model | Structure | Best for | Limitation |
|---|---|---|---|
| NN/g UX Maturity Model | Six stages — absent, limited, emergent, structured, integrated, user-driven — across four factors: strategy, culture, process, outcomes | Organisation-level diagnosis; strong on the leadership and culture dimensions | UX-framed rather than design-thinking-framed; the six stages are broad enough that most organisations land in stage 3 |
| InVision, The New Design Frontier | Five levels — producers, connectors, architects, scientists, visionaries — from a survey of 2,200+ organisations | Communicating maturity to executives; memorable level names | Self-reported impact data; the vendor is now defunct, so no updated dataset |
| McKinsey Design Index | Four themes scored against financial performance across 300 companies | Making the commercial case; the strongest evidence link of any model | A benchmarking study, not a self-assessment tool teams can run |
| Capability-maturity-style models (CMM-derived) | Five levels from initial to optimising | Process-heavy and regulated environments | Encourages documenting process rather than changing decisions |
Two data points from these are worth carrying into any internal conversation. InVision’s report found 41% of surveyed companies at Level 1 — the stage where design is treated as what happens on the screen. NN/g’s analysis of over 5,000 self-assessment responses found half sitting at stage 3, with very few at the highest end, and noted that the lowest-maturity organisations are probably not captured at all, since they are unlikely to have anyone taking a UX maturity quiz.
The practical implication: if your honest assessment lands you mid-scale, you are normal, not behind. The organisations to compare against are not the published exemplars.
The five dimensions to assess
The instrument below deliberately separates capability from outcomes, because the most common real-world pattern is competent practitioners with no path to influence.
| Dimension | What it measures | The question underneath |
|---|---|---|
| Strategy | Whether design thinking is connected to what the organisation is trying to achieve | Does anyone senior change a decision because of this work? |
| Capability | Depth and distribution of skill across the team | Could this run without the one person who knows how? |
| Process | Whether the method is embedded in how work normally happens | Does discovery survive a busy quarter? |
| Evidence | Quality and accessibility of what the team knows about users | Can someone find last year’s research in ten minutes? |
| Outcomes | Whether the practice measurably changes what gets built and what results | What did we stop doing because of what we learned? |
The 25-statement self-assessment
Score each statement 1–5, where 1 = not true at all, 3 = true sometimes or partially, 5 = consistently true and demonstrable. Score against evidence you could show someone. Total each dimension out of 25.
Strategy
- Design thinking work is initiated by business problems that leadership has named as important, not by teams looking for something to apply the method to.
- At least one senior leader outside the design or innovation function can explain, in their own words, why the practice exists.
- Discovery work has protected budget or capacity that is not raided when delivery pressure rises.
- The practice is attached to a business line with accountability for results, not run as a separate lab.
- In the last six months, a leadership decision changed direction because of evidence produced by this work.
Capability
- More than one person can independently frame a problem, plan research and synthesise findings to a usable standard.
- Non-designers — engineers, operations staff, product managers — participate in research sessions rather than reading summaries.
- The team distinguishes between generative research (what problem exists) and evaluative research (does this solution work), and uses each appropriately.
- There is a defined path for someone to move from awareness to practitioner to facilitator, and at least one person has travelled it.
- Facilitation of a workshop does not depend on a single individual being available.
Process
- Discovery activity happens continuously, not only at the start of projects.
- There is a defined point at which work moves from exploration to build, and it has a stated evidence requirement.
- Prototypes are tested with real users before build commitment, as a norm rather than an exception.
- The team regularly generates and compares multiple distinct solution options rather than developing the first plausible one.
- Problem framing is a named, time-boxed activity with an output someone owns — not an assumed preamble.
Evidence
- Research findings are stored somewhere searchable and are actually retrieved by people who did not conduct the study.
- Assumptions underpinning the current roadmap are written down somewhere, and their evidence status is visible.
- Research includes people who are not current users — churned, refused, or never-adopted.
- Raw evidence (recordings, transcripts, observations) is accessible to the team, not only summarised conclusions.
- When findings contradict a senior stakeholder’s belief, they are still reported.
Outcomes
- The team can name at least one initiative stopped or significantly redirected in the last two quarters because of research.
- Success is reported in outcome terms — adoption, task completion, retention, cost — not in activity terms.
- There is a measurable before-and-after comparison for at least one piece of work.
- Rework attributable to unvalidated assumptions has been measured, or at least estimated.
- Someone outside the team cites this work when making a case internally.
Reading your scores
| Total (out of 125) | Stage | What this typically means | The single highest-value next move |
|---|---|---|---|
| 25–49 | Nascent | Design thinking exists as workshops and enthusiasm. No structural connection to decisions. | Pick one real business problem with a named sponsor. Run one full loop end to end. Document the before-and-after. |
| 50–74 | Emerging | Real skill exists, usually concentrated in one or two people. Practice survives calm quarters and disappears in busy ones. | Protect capacity formally and build a second facilitator. Fragility, not skill, is the constraint. |
| 75–94 | Structured | The method is embedded in how projects run. Research happens reliably. Impact is still argued rather than demonstrated. | Attack the outcomes dimension: instrument one initiative properly and produce a defensible before-and-after number. |
| 95–114 | Integrated | Evidence changes decisions routinely. Non-designers participate. Leadership asks about outcomes. | Work on durability — succession, repository quality, and whether the practice survives a reorganisation. |
| 115–125 | Leading | Rare, and rarely stable. The practice shapes strategy rather than serving it. | Guard against decay. Re-assess quarterly; this level is easier to lose than to reach. |
Read your lowest dimension, not your total. The total is for tracking movement over time. The lowest dimension is the diagnosis.
Diagnostic: symptom to root cause
Practitioners usually arrive with a symptom rather than a score. This maps the common ones.
| What you observe | Dimension most likely failing | Intervention |
|---|---|---|
| Great workshops, nothing changes afterwards | Strategy | Attach every session to a named decision, a decision owner and a date, before it runs |
| Research happens, then the roadmap proceeds unchanged | Evidence + Strategy | Ask, before research begins, what would have to be true for the team to change course |
| The practice stops whenever delivery gets busy | Process | Formalise protected capacity; treat raiding it as a process breach, not a trade-off |
| Only one person can run any of this | Capability | Pair-facilitate everything for a quarter; the second facilitator is the highest-return investment available |
| Nobody can find last year’s research | Evidence | Build a searchable repository and link it from backlog items — research nobody can find is research nobody did |
| Leadership asks how many workshops were run | Outcomes | Change the reported metric before trying to change anything else |
| Findings that contradict the sponsor never surface | Evidence (but really culture) | This is a psychological safety problem before it is a method problem |
| Everything gets validated; nothing is killed | Outcomes | Track “ideas killed before build” explicitly and report it as a positive |
The final row is worth dwelling on. A discovery practice with a 100% proceed rate is not doing discovery, it is doing justification. If your team has never stopped anything, the assessment score is optimistic regardless of what the instrument says.
How to run the assessment
Who scores. Three groups, separately: the core practitioners, one or two engineering or operations colleagues who work alongside them, and the sponsor. Scoring them separately and then comparing is more informative than the scores themselves — a large gap between practitioner and sponsor scores on the strategy dimension is itself the finding.
Timebox it. Ninety minutes: twenty minutes individual scoring, forty minutes discussing only the statements with the widest disagreement, thirty minutes agreeing the single next move.
Score against artefacts. For every statement scored 4 or 5, someone should be able to name the evidence. This one rule removes most of the inflation.
Cadence. Every six months. Quarterly if you are actively working on a dimension. More often than that and you are measuring noise; less often and you will miss regression after a reorganisation.
What to do with the result. One dimension, one intervention, one quarter. Teams that try to lift all five simultaneously lift none. The sequencing that works most often is: fix Strategy first if it is low (nothing else matters without it), then Process, then Outcomes, then Evidence, with Capability worked continuously underneath.
Five pitfalls in running maturity assessments
- Turning the score into a target. The moment maturity level becomes an objective, scoring inflates and the instrument stops being diagnostic. Countermeasure: keep the assessment inside the team, and report the intervention upward rather than the score.
- Assessing the organisation when you mean the team. These are different questions with different answers. A mature team inside an immature organisation is a real and common condition; the interventions are entirely different. Countermeasure: state the scope explicitly before scoring.
- Skipping the sponsor. The strategy dimension cannot be self-assessed by practitioners, because it measures something happening in someone else’s head. Countermeasure: score the sponsor separately and compare.
- Treating it as a one-off. A single assessment produces a snapshot with no trend. The second assessment is where the value is. Countermeasure: book the follow-up before finishing the first.
- Confusing headcount with maturity. InVision’s own finding was that team size is a poor predictor: large teams sit low on the scale and small teams reach advanced benefits. Countermeasure: never use headcount as a proxy for capability in the assessment.
A 90-day plan from assessment to movement
| Phase | Focus | Concrete steps |
|---|---|---|
| Days 1–15 — Assess honestly | Get a diagnosis you believe | Run the 25-statement instrument with three separate scoring groups. Discuss only the widest disagreements. Name the single lowest dimension. |
| Days 16–60 — One intervention | Move one dimension, not five | Pick the intervention from the diagnostic table. Assign a named owner. Do not add a second intervention, however tempting. |
| Days 61–90 — Evidence the move | Make the change visible | Produce one artefact that proves the shift — a repository people use, a killed initiative, a before-and-after number, a second facilitator running a session solo. Re-score only the dimension you worked on. |
Frequently asked questions
What is a design thinking maturity assessment?
A structured way of judging whether a team’s design thinking practice is actually influencing decisions, rather than whether it is active. It typically scores several dimensions — strategy, capability, process, evidence and outcomes in the model above — and produces a diagnosis and a next move rather than a certification.
How is design thinking maturity different from UX maturity?
They overlap substantially and the established models are largely interchangeable in practice. UX maturity models like NN/g’s tend to emphasise research operations, design systems and the UX function’s organisational standing. Design thinking maturity emphasises problem framing, option generation and whether evidence changes decisions across functions, including outside product teams. If your practice extends into strategy, operations or HR, the design thinking framing fits better.
Which maturity model should we use?
Use NN/g’s if you need an organisation-level diagnosis with strong grounding in culture and leadership. Use InVision’s five levels if your primary need is communicating to executives, because the level names travel well. Use an instrument like the one above if you want something a team can run itself in ninety minutes and act on. Most practitioners end up using one for internal work and citing another upward.
Can a single team be mature inside an immature organisation?
Yes, and it is a common and unstable condition. The team will typically score well on capability, process and evidence, and poorly on strategy and outcomes — because the work is good and nobody senior acts on it. The intervention is not more skill. It is finding one sponsor with a real decision and attaching to it.
How often should we reassess?
Every six months as a default, quarterly while actively working a dimension. Also reassess after any significant reorganisation, leadership change or budget cycle, since maturity regresses under all three.
Does a higher maturity score guarantee better business results?
No. The correlation between design maturity and financial performance is well-evidenced at population level — McKinsey’s design index work being the strongest example — but it is a correlation across companies, not a guarantee for yours. Treat maturity as a leading indicator to be validated against your own outcome data, not as a proxy for it.
What if our score is low?
That is the normal result. InVision found 41% of over 2,200 companies at their lowest level, and NN/g’s data placed half of respondents mid-scale with very few at the top. A low score with one clearly identified intervention is a more useful position than a high score nobody can explain.
Where to start
If you take one thing from this guide, take the rule about scoring against artefacts. Every statement rated 4 or 5 needs something you can point at — a repository, a killed initiative, a decision that changed, a second person who can facilitate. That single constraint converts a maturity assessment from a conversation about how the team feels into a conversation about what the team can demonstrate.
Score honestly. Work the lowest dimension. Re-score in ninety days.
Humane Design builds design and innovation capability that survives contact with a delivery calendar — including maturity diagnostics, practitioner and facilitator development, and embedded coaching on live projects. Explore our design thinking learning services, design thinking consulting and corporate training approach. Our resources and case studies show these assessments applied in practice.